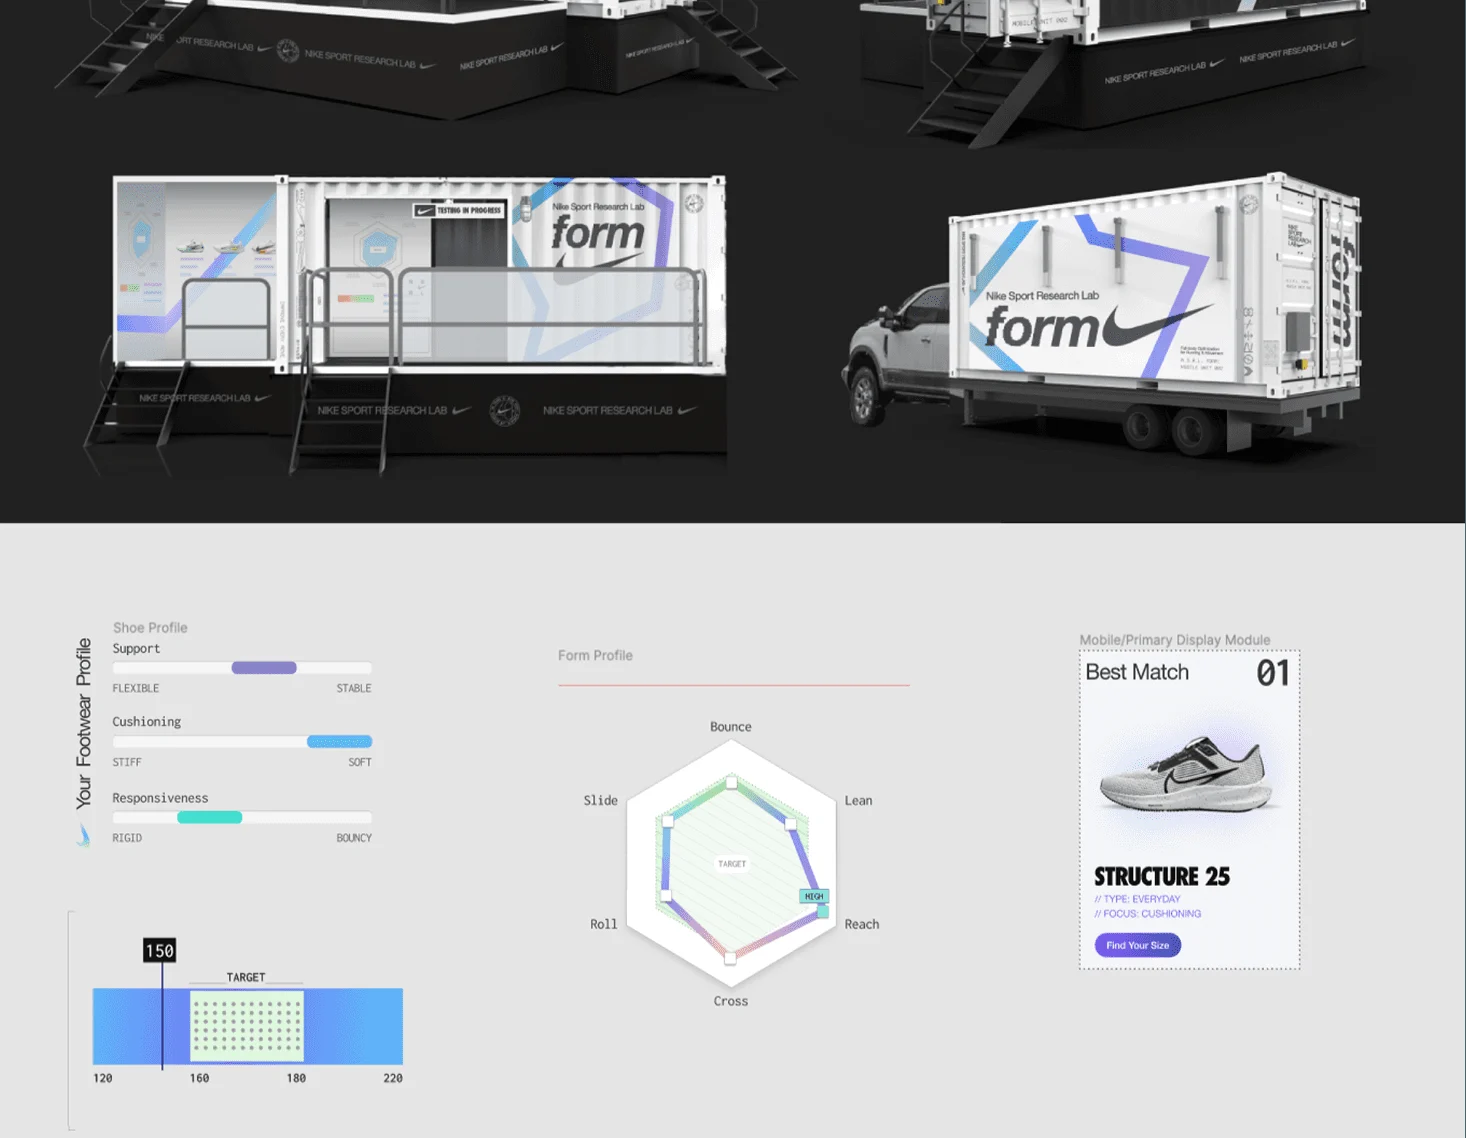
Case study · Nike Sport Research Lab
Making scientific running analysis human
I designed this from the runner’s point of view: someone experiencing scientific running analysis for the first time. Working with Nike’s leadership, engineering and science teams, I shaped every step, from the moment they discover the service to the moment they put the suggestions into practice, into one cohesive human + science experience.
The mission
Transform a lab experience perceived to be ‘cold’ and ‘for elite men only’ into a comprehensive suite that brings out the why (the people) in the what (the data).
The result
A 0 to 1 product redesign (responsive web product), applications, scientific report, design system, design guidelines, token library, component library, UI/UX and motion design.
User research & strategy
Starting with user research helped level-set the core team of exec, science, marketing and service leads into a shared understanding that running analysis should appeal to new runners first.
Breaking down digital touchpoints and then entering them as user stories on a design kanban, I worked with the team to create a transparent design strategy. Work was then prioritized, collaboratively, with the core team and engineering architect.
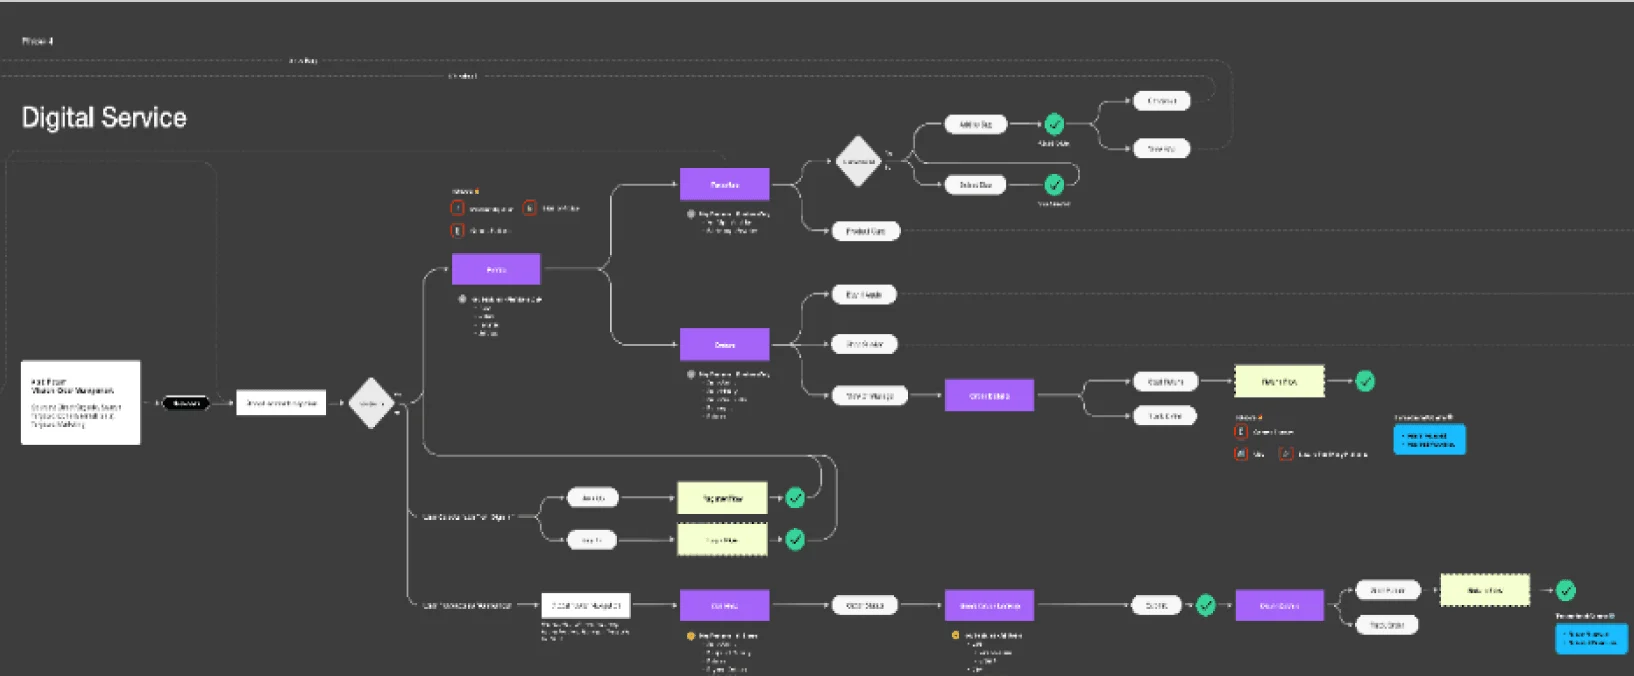
Wireframes and testing
I then created interactive wireframe flows of key processes so we could test them on usertesting.com and demonstrate them to stakeholders.
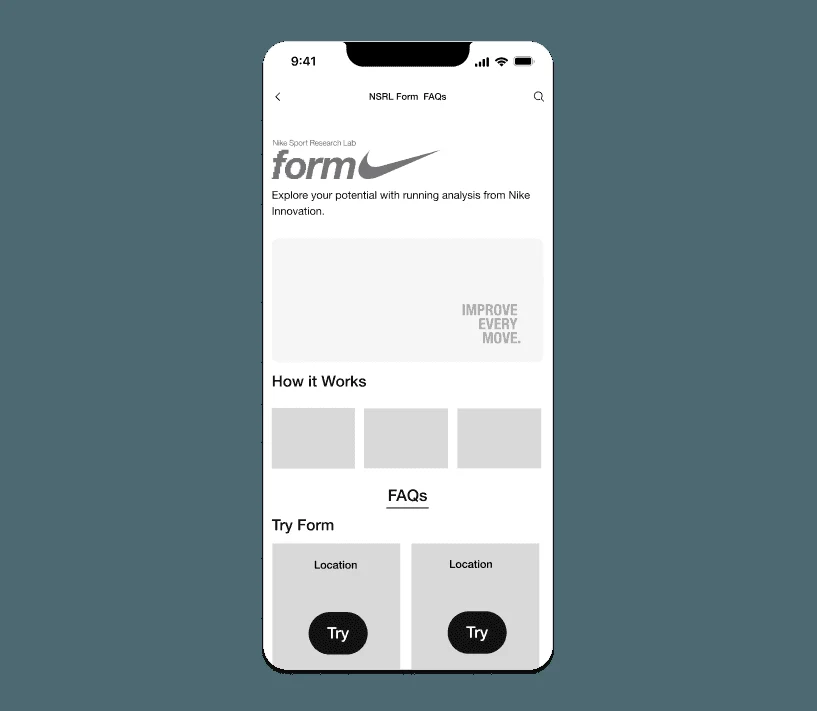
Responsive UX and UI
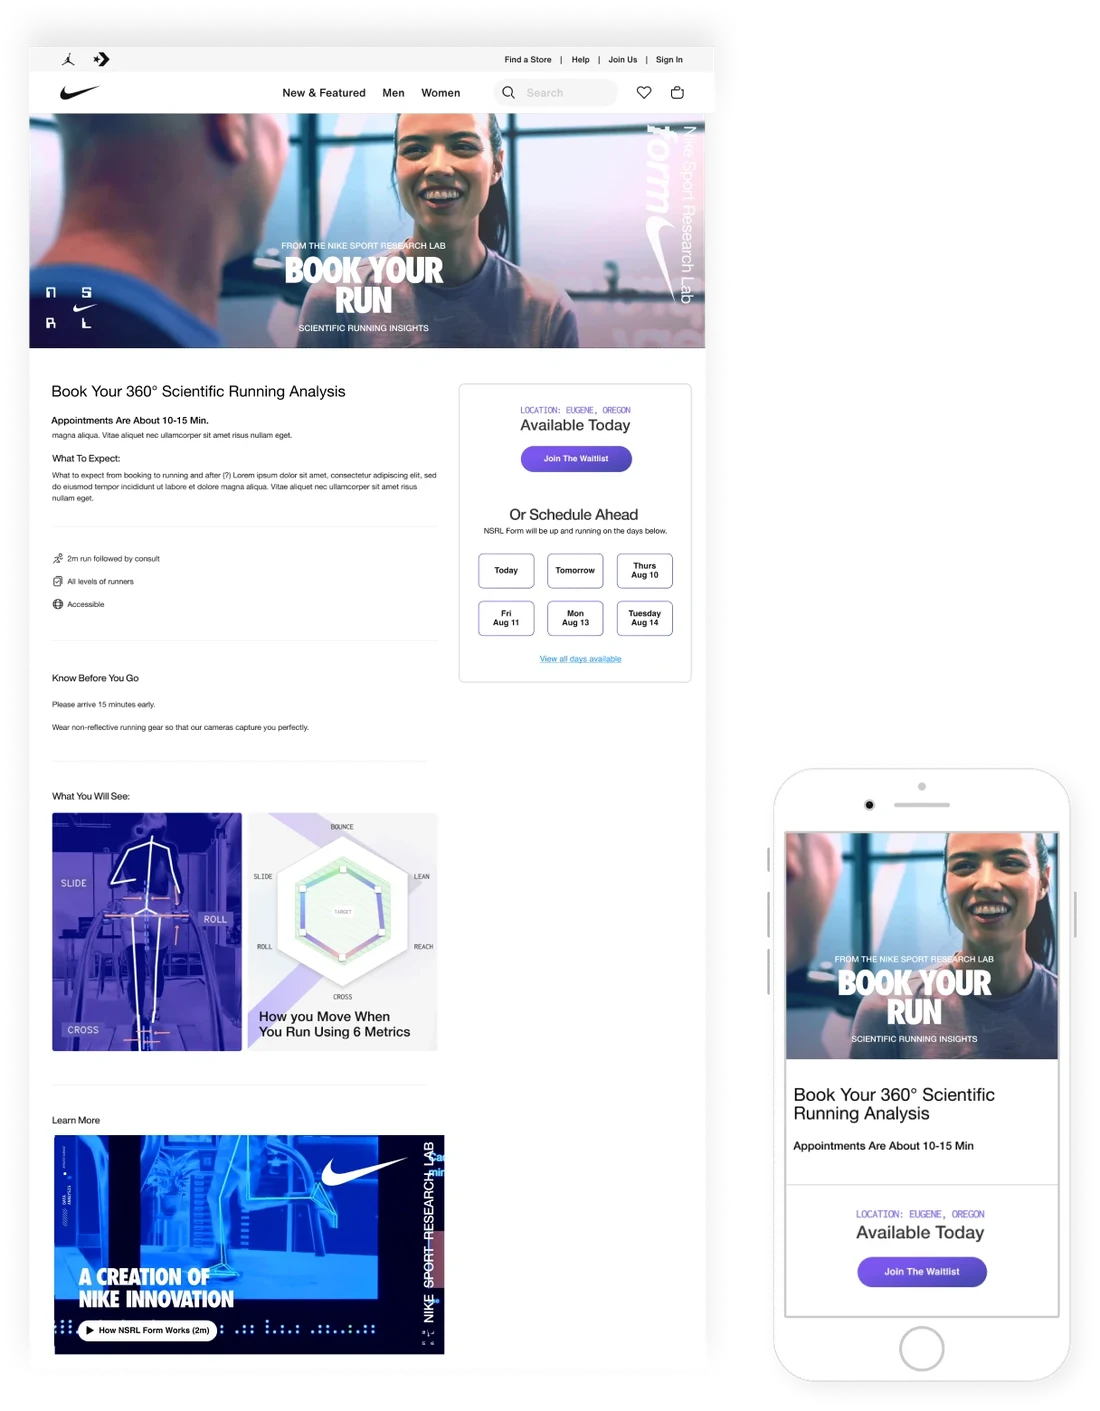
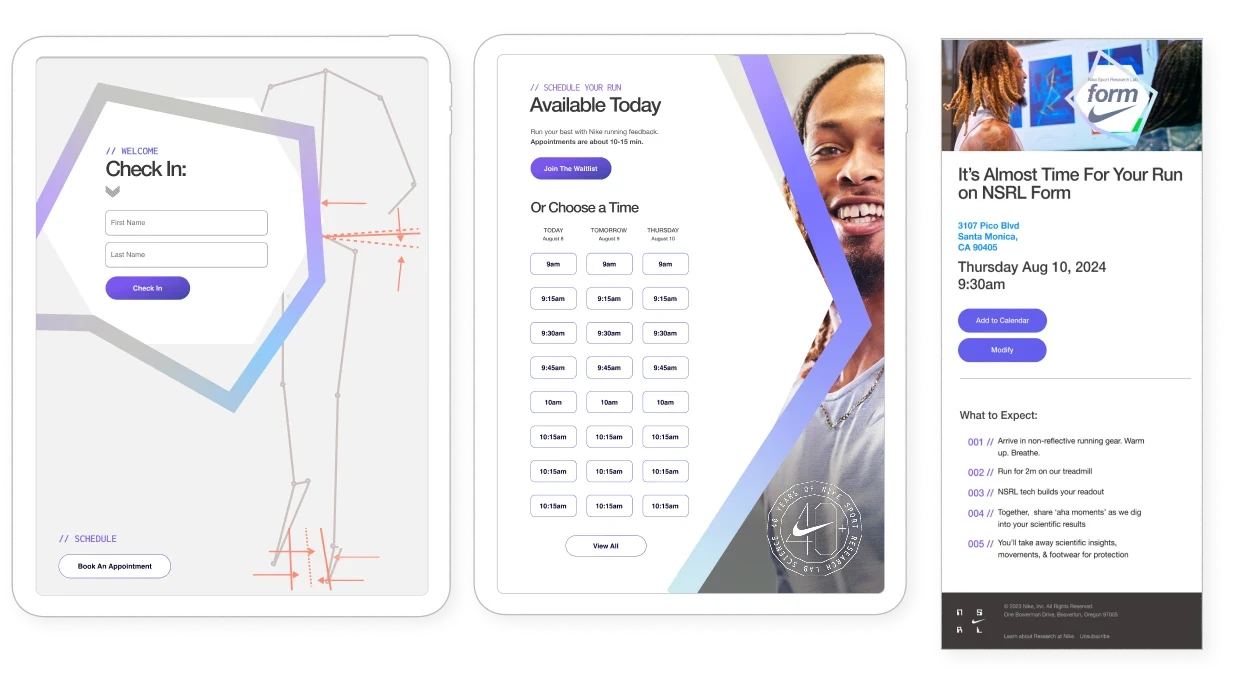
Responsive websites and applications were created using a new visual design system. Creating repeating patterns in the designs greatly sped up development.
Service design and scientific display
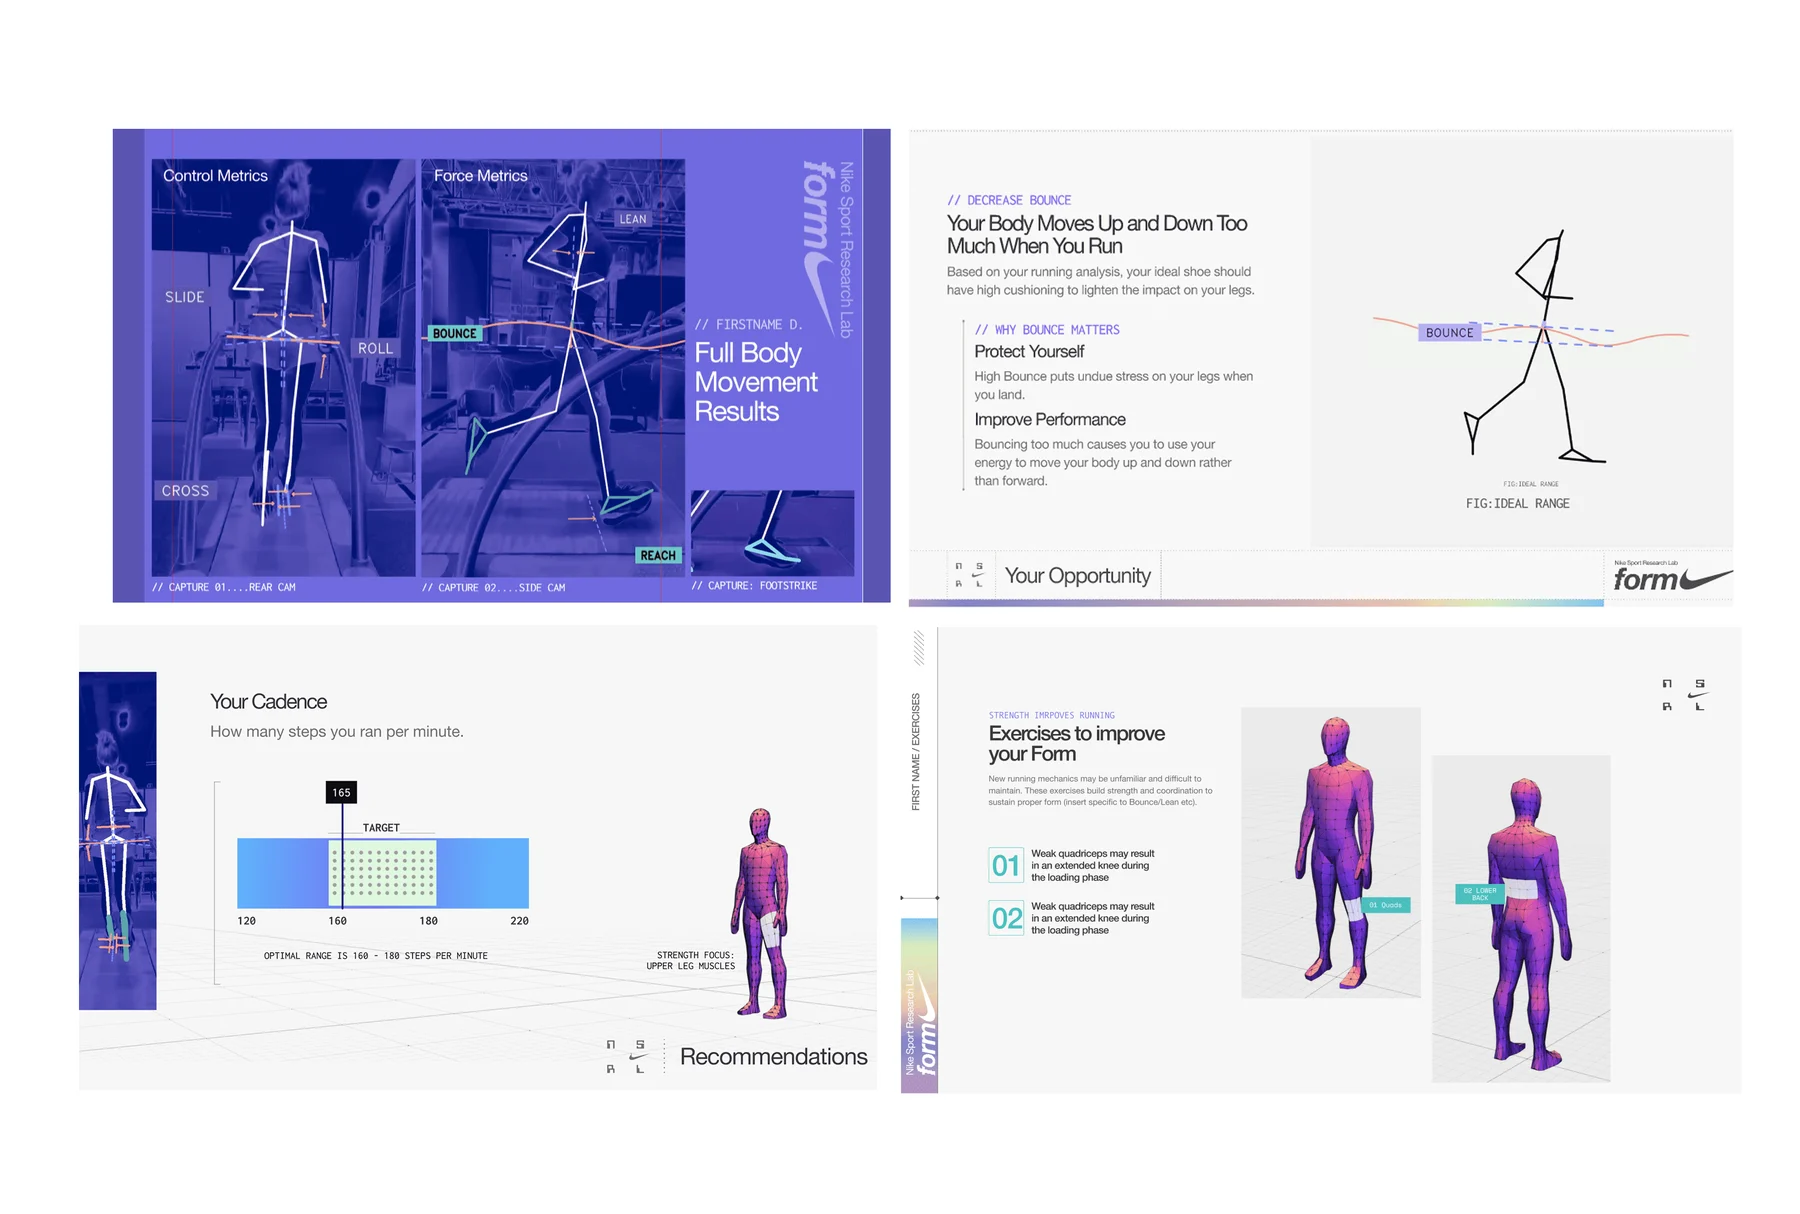
Working with the lead service designer, we remade the pacing of the digital report runners receive after they run. Feedback (from a feedback design itself) showed that the new report increased adoption of recommendations by 70%.
70%increase in runners adopting their recommendations
Motion design
Adding motion to the website by creating short instructional videos and animating headers helped bring life to the digital experience, without requiring additional development time.
Physical space design & flow
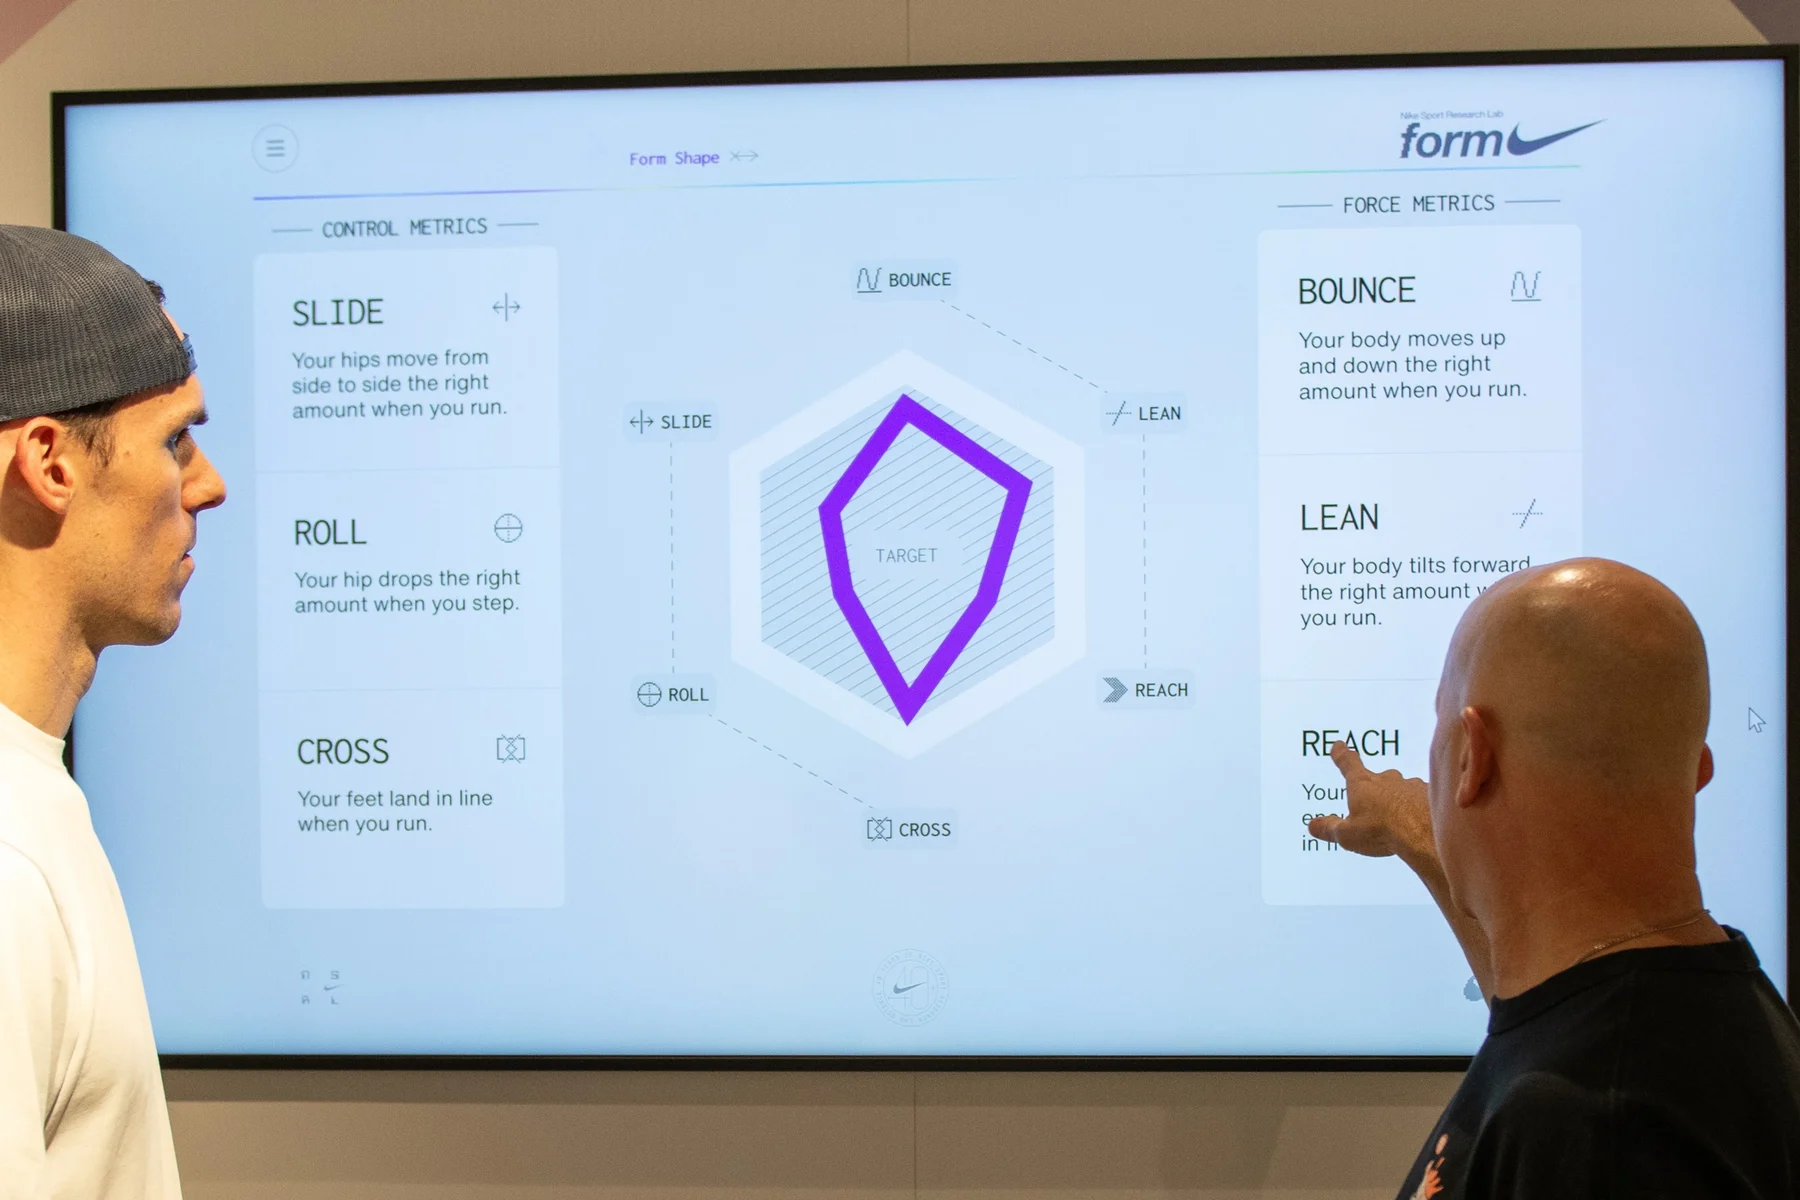
After reworking the display of scientific data, we added it to the physical spaces where runners ran, to increase awareness about what to expect.